
Trace Linux Service Latency with cgroup v2
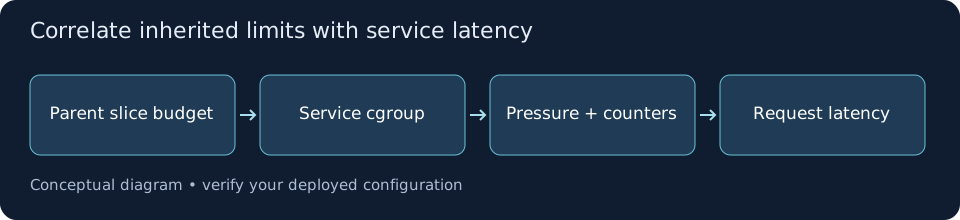
A service can be slow while its host looks idle because it reaches a cgroup resource limit. This guide investigates a running systemd service on a Linux host using the unified cgroup v2 hierarchy. It correlates resource pressure with application response time; it does not trace individual requests or replace application profiling.
Confirm the Hierarchy and Service Cgroup
ScopeCheck the cgroup filesystem type, available controllers, and service path. Do not continue with these v2 file names if the host uses cgroup v1. Keep the variables in the same Bash session. Validate a nonempty absolute cgroup path before constructing the filesystem location; an inactive service may no longer have a populated group.
stat -fc %T /sys/fs/cgroupcat /sys/fs/cgroup/cgroup.controllerssystemd --version | head -n 1unit='app.service'systemctl is-active "$unit"cg_path=$(systemctl show "$unit" -p ControlGroup --value)case "$cg_path" in /*) cg_dir="/sys/fs/cgroup$cg_path" ;; *) printf '%s\n' 'No service cgroup found; stop here.'; exit 1 ;;esactest -d "$cg_dir" || exit 1printf '%s\n' "$cg_dir"systemctl show "$unit" -p MainPID -p Slice -p ControlGroup❯ What to Verify
The filesystem type is cgroup2fs and the target service maps to the intended cgroup directory.Measure Application Latency and Host Pressure Together
BaselineUse a repeatable, authorized request or workload with a fixed concurrency and data set. Record errors and response-time distribution from application monitoring. The curl command gives one request’s connection, first-byte, and total times; it is not a p95 benchmark. Sample resource pressure in the same time window and keep credentials out of logs.
date -u# Replace with an approved health or test endpoint.curl --silent --show-error --output /dev/null \ --write-out 'http=%{http_code} connect=%{time_connect} first_byte=%{time_starttransfer} total=%{time_total}\n' \ http://127.0.0.1:8080/healthfor resource in cpu memory io; do printf '\nHost %s pressure\n' "$resource" cat "/proc/pressure/$resource"donevmstat 1 5❯ What to Verify
A comparable workload window has both application timings and CPU, memory, and I/O pressure samples.Sample CPU Quota and Throttling Deltas
CPU EvidenceRead quota configuration and sample cpu.stat twice. nr_throttled and throttled_usec increasing during the slow interval support a quota-throttling hypothesis. Cumulative values alone cannot date an incident. A quota of 100 percent represents one CPU’s time, not the entire capacity of a multicore host. CPUWeight controls relative sharing under contention rather than imposing a hard quota.
systemctl show "$unit" -p CPUQuotaPerSecUSec -p CPUWeight -p AllowedCPUsfor sample in 1 2; do date -u sudo cat "$cg_dir/cpu.max" sudo cat "$cg_dir/cpu.stat" sudo test ! -f "$cg_dir/cpu.pressure" || sudo cat "$cg_dir/cpu.pressure" test "$sample" -eq 2 || sleep 10done❯ What to Verify
Compare changes in nr_periods, nr_throttled, and throttled_usec during the interval with the application's latency.Check Memory Reclaim and I/O Stalls
Other ControllersRead only files available for the service. MemoryHigh can cause reclaim and throttling before MemoryMax is reached; increases in the high event counter help identify that boundary. MemoryMax is a hard cap and can lead to cgroup OOM. I/O pressure reports stalls, while io.stat reports bytes and operations rather than request latency. Correlate with device-level metrics and application access patterns.
systemctl show "$unit" -p MemoryCurrent -p MemoryHigh -p MemoryMax -p IOWeightfor metric in memory.current memory.high memory.max memory.events \ memory.pressure io.stat io.max io.pressure; do if sudo test -f "$cg_dir/$metric"; then printf '\n%s\n' "$metric" sudo cat "$cg_dir/$metric" fidone# If sysstat is installed:iostat -xz 1 5sudo journalctl -k --since '15 minutes ago' --no-pager❯ What to Verify
Identify growing memory high/oom counters or I/O stalls, and compare them with current device and kernel evidence.Inspect Parent Slices for Inherited Limits
HierarchyA service inherits restrictions from ancestor cgroups. An unlimited child can still be constrained by its parent slice. Walk from this service to the hierarchy root and read the applicable limits. If the application creates delegated subgroups, inspect the actual worker’s membership as well; a main PID can be only a supervisor.
parent_dir="$cg_dir"while test "$parent_dir" != /sys/fs; do printf '\nCgroup: %s\n' "$parent_dir" for metric in cpu.max memory.high memory.max io.max; do if sudo test -f "$parent_dir/$metric"; then printf '%s: ' "$metric" sudo cat "$parent_dir/$metric" fi done test "$parent_dir" = /sys/fs/cgroup && break parent_dir=$(dirname "$parent_dir")donesystemd-cgls "$cg_path"# Replace with an actual worker PID from the tree:cat /proc/WORKER_PID/cgroup❯ What to Verify
The limiting boundary is located at the service, a worker subgroup, or an ancestor slice.Reproduce CPU Throttling in a Bounded Lab
Optional DemonstrationOn a disposable systemd host, create a transient service running one CPU-bound process with a 20 percent quota. It stops after 30 seconds and is collected afterward. Inspect it while active. This shows what quota throttling looks like without changing a production unit. Skip the demo if the name already exists; even bounded load needs spare capacity.
demo_state=$(systemctl show --property=LoadState --value cgroup-latency-demo.service) || { printf 'Could not check the transient unit name; stop here.\n' >&2 exit 1}if [[ "$demo_state" != 'not-found' ]]; then printf 'The demo unit name is already in use; choose another name.\n' >&2 exit 1fisudo systemd-run --unit=cgroup-latency-demo --collect \ -p CPUQuota=20% -p RuntimeMaxSec=30s \ -p StandardOutput=null -p StandardError=null /usr/bin/yes || exit 1demo_path=$(systemctl show cgroup-latency-demo.service -p ControlGroup --value)case "$demo_path" in /*) sudo cat "/sys/fs/cgroup$demo_path/cpu.stat" ;; *) printf '%s\n' 'Demo already ended or did not start.' ;;esacsleep 5case "$demo_path" in /*) sudo cat "/sys/fs/cgroup$demo_path/cpu.stat" ;;esacsudo systemctl stop cgroup-latency-demo.service❯ What to Verify
While the demo is active, throttling counters should increase; after stopping, the transient unit is eligible for collection.Test One Approved Change and Restore It
Controlled ExperimentFor a canary only, compare the same workload before and after one resource adjustment. First record whether a runtime override already exists and its original value. The CPUQuota example is a temporary one-CPU budget, not a universal recommendation. Restore the original quota afterward; an empty value removes the quota at this boundary and is appropriate only if that was the baseline. Parent limits still apply.
systemctl cat "$unit"systemctl show "$unit" -p CPUQuotaPerSecUSec# Approved canary example only:sudo systemctl set-property --runtime "$unit" CPUQuota=100%# Repeat the same application measurement and Steps 3-5.# Restore the exact recorded original quota, for example:sudo systemctl set-property --runtime "$unit" CPUQuota=20%# If the original had no quota, use CPUQuota= instead of 20%.systemctl show "$unit" -p CPUQuotaPerSecUSec❯ What to Verify
The comparison records latency, errors, throttling, and effects on other workloads; the original resource budget is restored.Preserve Evidence and Decide Whether to Escalate
ConclusionRecord the unit and ancestor limits, controller availability, sample times, counter deltas, request load, errors, and latency distribution. A better result after one change strengthens the hypothesis but does not prove all production workloads are safe. If resource stalls do not correlate with latency, investigate application locks, downstream services, networking, and storage paths. Persist only a reviewed configuration with a rollback plan.
systemctl cat "$unit"systemctl show "$unit" -p ControlGroup -p Slice \ -p CPUQuotaPerSecUSec -p MemoryHigh -p MemoryMax -p IOWeightsudo journalctl -u "$unit" --since '30 minutes ago' --no-pager# Attach the same-window application metrics and counter samples to the change record.❯ What to Verify
The evidence identifies a resource boundary or rules it out for this workload window, with follow-up ownership and rollback documented.